You must load a chart in the ChaosHunter Trader to begin using the program. A chart allows you to export data to ChaosHunter in order to create a model. You can also use a chart to send trades to the IB Trader Workstation or monitor trading signals in real time once you add a ChaosHunter model to the chart.
Create A Chart
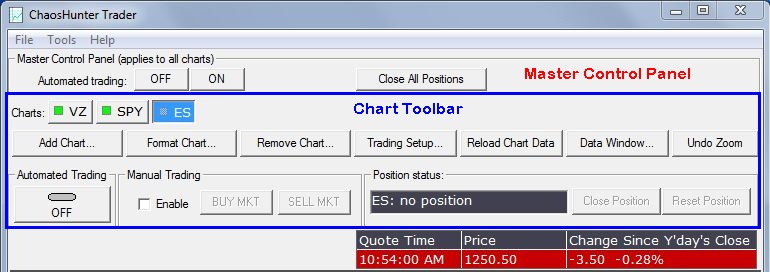
Click on the Add Chart button to start building a chart in the ChaosHunter Trader. Charts may be based on any of the Interactive Brokers trading symbols for stocks, futures, or cash (Forex). ChaosHunter Trader works with the following bar sizes: 5, 10, and 30 seconds, 1, 2, 3, 5, 15, and 30 minutes, 1 and 4 hour bars, and daily bars, which are the bar sizes supplied by Interactive Brokers. The user must be subscribed to the IB datafeed that supplies both historical and real-time data.
When you click on the Add Chart button in the Chart Toolbar the Select Symbol Screen is displayed. It shows several preset symbols installed with the program as well as any you have entered previously.
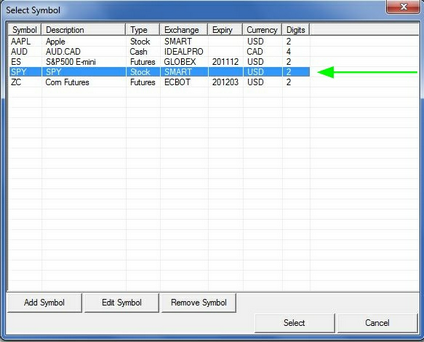
Click on any symbol currently in the list and then click on the Select button to display the Set New Chart Properties screen (see below for details).
If the symbol is not on the list, click on the Add Symbol button to display the Add New Symbol dialog box. Enter the requested information (described below). The information must match the IB Trader Workstation. To determine the correct symbol specifications in the IB Trader Workstation, select the Portfolio tab in IB Trader Workstation and select a blank line. Begin to type the symbol on the line and hit the Enter button. A dialog begins that displays the symbol, the exchange and the type of instrument. You may also use this dialog box to search for a symbol based on the company name. Once a symbol is displayed in the Trader Workstation, you can right click on the symbol name, select contract info, and get complete details about the symbol. The user must be subscribed to the IB datafeed that supplies both historical and real-time data.
Stocks and Futures
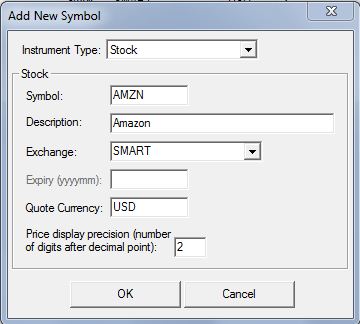
Instrument Type: Click on the arrow to display instrument categories such as Stock, Futures, and Cash (Forex). Select the instrument category that matches your symbol. For the example above, we selected an instrument type of Stock and typed in the symbol AMZN.
Description: Enter your own description of the instrument.
Exchange: Click on the arrow to display the list of exchanges offered by Interactive Brokers: GLOBEX, IDEALPRO, NYMEX, and SMART. Click on the exchange that matches the one displayed in the IB Trader Workstation. If the exchange you want is not listed, type the name of the exchange in the box.
Expiry (yyyymm): This box is only available if you are trading futures contracts. The year must include 4 digits and the month must include 2 digits. For example, if a contract expires in March 2012, the date should be entered as 201203.
Quote Currency: Enter the type of currency in which the instrument is traded. For most US equities and futures, you would enter USD. If the US equity is traded in other currencies such as British pounds or Euros, enter the symbol for that currency, e.g., GBP or EUR. Currency symbols are the same ones that are used in Forex pairs.
Price display precision: For stocks and futures, 2 decimal places are sufficient.
Cash (Forex)
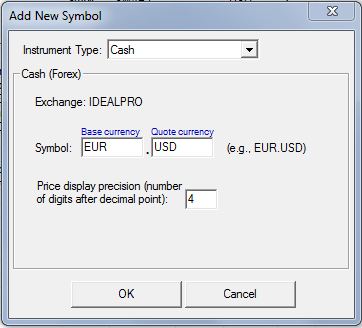
Instrument Type: Click on the arrow to select Cash
Exchange: IDEALPRO (the only option for Forex trading with Interactive Brokers)
Symbol: If you are trading Forex pairs, the base currency (the currency you are buying) is listed on the left, and the quote currency (the currency you are using to pay for the transaction) is listed on the right. In the example above, you are buying Euros (the base currency) and paying with US dollars (the quote currency).
If you want to trade a cross pair that does not include your home currency (the currency in your account), click here for details.
Price display precision: For Forex, it is recommended that you display 4 or 5 decimal places.
If you have any questions about the correct symbols to use, contact the Interactive Brokers technical support.
After you have entered the required information, click on the OK button to add the symbol to the Symbol list.
Once the symbol is displayed on the list, you may create a chart by choosing the symbol from the list and clicking on the Select button. The Set New Chart Properties form is displayed, where you can specify chart settings such as bar size, how far back to load data, etc. Once you have entered your selections, click on the Add New Chart button to download data from IB Trader Workstation and display the chart.
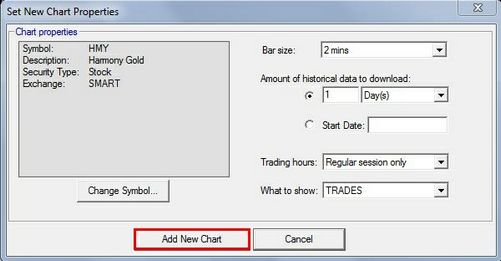
Bar Size: The ChaosHunter Trader works with the following bar sizes: 5, 10, and 30 seconds, 1, 2, 3, 5, 15, and 30 minutes, 1 and 4 hour bars, and daily bars, which are the bar sizes supplied by Interactive Brokers.
Amount of Historical Data to Download: Either enter a number of days, weeks, or months, or specify a start date. Note that if you specify a certain number of days back, the request will be for calendar days, not trading days. Therefore the data will include weekends and holidays, so you may not obtain data for the total number of days you specified.
If your ChaosHunter model uses the Chaos Input (the Chaosvar), you should specify the same start date that you used to train your model. Click here for details.
You must load enough historical data for the ChaosHunter model to calculate in order to generate trading signals. For example, if your ChaosHunter model includes an indicator such as %chg(Close, 10) the chart would have to include 10 bars before a trading signal could be generated. Otherwise, you will see the message "Not enough bars to fire the model" in the Order/Trade log of the ChaosHunter Trader." The message is most likely to be seen at the start of the trading day if you have only loaded one day of data, for example. To correct the problem, simply increase the amount of data loaded so the computations in the ChaosHunter model have sufficient historical data to produce trading signals.
Trading Hours: Click on the drop down arrow to select either All available data or Regular session only for stocks or futures. For cash (Forex), all available data is supplied automatically.
What to Show: Click on the drop down arrow to select the price data you want displayed on the chart. (The price data should match the data used to train your ChaosHunter model.) The available selections will vary by the type of instrument: Trades, Midpoint, Bid, or Ask.
Trades includes the open, high, low, and close prices as well as volume.
Interactive Brokers does not supply trades or volume data for Forex. If you select trades for a Forex chart, the ChaosHunter Trader will display the midpoint values. For Forex, the midpoint refers to the average of the bid and ask prices.
For stocks and futures, midpoint refers to the average of the high and low price.
Bid or Ask bars display the open, high, low, and close prices for either the bid or ask prices respectively.
If you have any questions about how these bars are created by Interactive Brokers, please contact Interactive Brokers technical support.