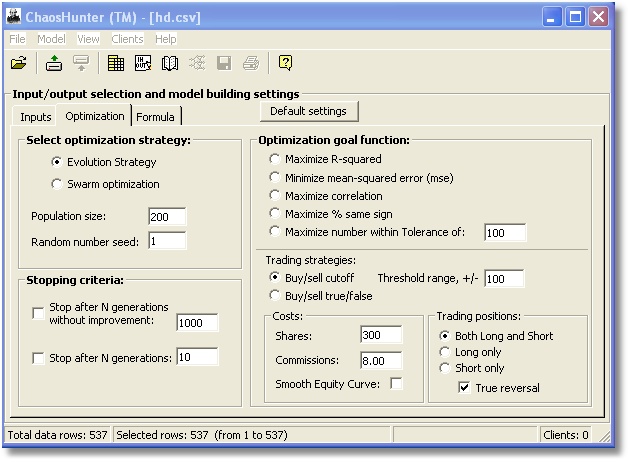
Select optimization strategy:
ChaosHunter offers two different techniques for selecting the terms that will appear in the formula that solves your problem. It is suggested that you try both Evolution Strategies and Swarm Optimization to see which optimization works best for your particular problem.
Population size: 100 default
The larger the population size you choose, the greater the chance that effective models are found. Larger populations, however, require much more time to process, so that new populations are created much more slowly. Finding a good balance is important, and the most effective population sizes we have found are from 100 to 500. If you have a large data set (say over 20,000 rows) then smaller populations may be in order. If you have a lot of time to run your models, you might try populations of 1000 or 2000.
Random number seed: 1 default
The random number choice allows you to select different random seeds. No random number seed has any more probability than any other of producing the best solution. Often if optimization doesn't produce good results, then stopping and restarting from the beginning with a new seed can be helpful.
Stopping Criteria
Stop after N generations without improvement: 1000 default
Stop after N generations: 1000 default
It will usually be better to continue optimizing until at least 200 generations have past without improvement. If you are very familiar with your problem, and you are running with slightly newer data, you might have observed that after some number of generations (N) seems to work well, in which case you might choose to stop after that number of generations. In our modeling, we prefer to select neither, and simply watch the progress, stopping the optimization manually when we feel that progress is no longer being made.
You should understand that finding an analytic model with traditional functions can take a great deal of time. In our work, optimizing for 2 to 6 hours is not uncommon, and even longer for difficult problems.
Select Optimization goal function:
There are five goal functions at the top for curve fitting, and two at the bottom for financial trading models. Click here for a technical description of these goals.
R-Squared is a good general purpose goal for all types of data where you are trying to fit curves. That is because in all cases your goal is to get close to 1.
The Mean Squared Error goal is useful when you want the closest fit you can get between actual and predicted values. It tends to work on shrinking the largest errors first. However, it is difficult to judge by looking at the mean squared errors whether the fit is good enough.
The Correlation goal is useful when you are not as much concerned about actual vs predicted as you are with whether the predictions generally move in the same direction as the actuals move.
Maximize % same sign is really a classification goal, useful for making models to classify data in one of two categories instead of curve fitting. It assumes that one category is characterized by zero or positive actual answers, and the other is characterized by negative ones.
Maximize number within tolerance is best used when your goal is to get all predictions somewhat close to the correct answer, rather getting some very close while others aren’t close enough. With this goal the optimizer stops working on results that are already within a tolerance, so that it can concentrate on those that are not within tolerance.
Buy/sell cutoff is for building trading models, where you are interested in making the most profitable trade timing models. The idea is to create a formula such that whenever the formula is greater than some number x, a buy trade will take place on the next bar (row of data in the time series). Whenever the formula is less than or equal to some number y, a sell trade will take place on the next bar. The numbers x and y are found by the optimizer in the Threshold range you set. For example, if the threshold range is 5, x and y will both be greater than or equal to -5 and less than or equal to 5.
Use buy/sell true/false instead if your formula is supposed to produce true/false results (see the description of the XOR example for more details on true/false results).
Shares, commissions, and Smooth Equity Curve are discussed in the topic Building Trading Models.