Choosing an Output for Trading Models
When using ChaosHunter to build trading models, the output chosen should not be the result the formula is expected to compute. The goal of building a good trading model is to make the most money, not to have some prediction be close to some answer. Therefore the output must instead be the price time series on which the trades will be made. Usually this price will be the Open of the bar (row of data) or the Close of the bar. Since the trade is simulated to be made on the bar after the bar on which the formula is computed, it is obviously better to use the Open as the price (do not select scaling); otherwise the trade is not simulated to be made until the end of the next bar instead of at the beginning. The way this output is used and how the decision is made about when to trade will be explained below.
Technical Indicators as Inputs
From Data Files: The inputs for trading models should not be just open, high, low, close and volume. You should be using some technical indicators to improve your chances of building a profitable model. If you export your data from a program like the NeuroShell Trader, then it will be easy to include some technical indicators in your data file. Indicators imported from data files will be treated as values rather than indicators with parameters that may be optimized.
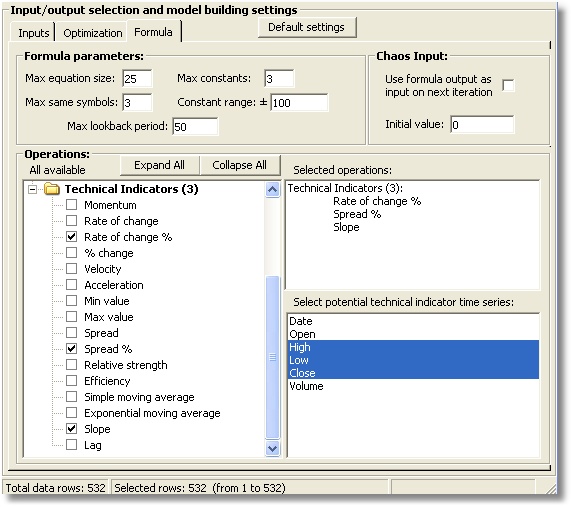
Created within ChaosHunter: ChaosHunter has a number of technical indicators you can use if you don’t have them in your data file already. ChaosHunter will even find the best parameters to use in its technical indicators. If you use the ones in the ChaosHunter, and you have only open, high, low, close, and volume in your data files, then do not select any inputs. Instead, select which of open, high, low, close and volume you want to be fed into the technical indicators as parameters. You do this on the Formula tab.
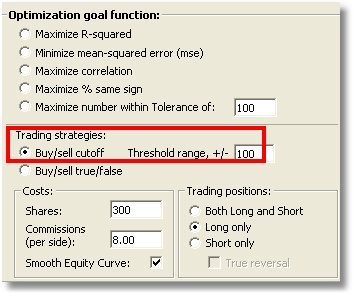
Most of the effective trading models we have made use a real valued output (use Threshold range) instead of true/false outputs. Either way the goal is to make the most money. If you select “Smooth equity curve” while optimizing, the optimizer will still try to make more money, but it may give up some profit in order to achieve a smoothly rising equity curve. A smoothly rising equity curve will mean the model has experienced less severe “drawdowns”.
How Buy/Sell Signals Work
The ChaosHunter either buys or sells. If you are not in a position when a sell occurs, the model will go “short”. A subsequent buy signal “covers” the short position. Yet another buy signal causes the model to enter into a “long” position. Yet another sell signal causes the model to exit its long position.
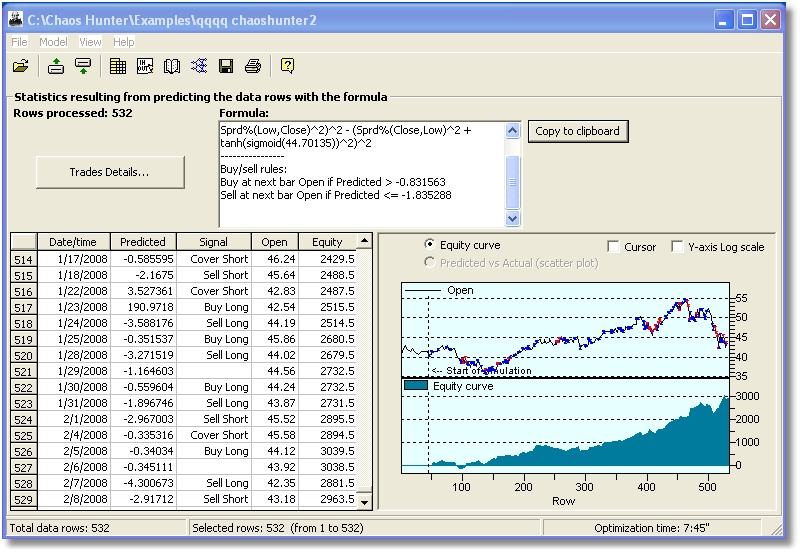
Some believe it is more efficient to reverse directly from a long position into a short, and vice versa, i.e. exiting the former position at the same time you enter the new one. Usually this is done by buying or selling double your current position. If you want this type of model, turn on the checkbox called “True reversal”.
How to Use Commissions
You may choose number of shares to simulate trading when building the model, as well as the commission. You should view the commission not so much as a method to give you accurate performance results, but more as a tool to affect how the model is built. Specifying larger commissions will result in models that trade less frequently; specifying lower commissions will result in models that train more frequently. Don’t be afraid to try different commission amounts.
Setting the Threshold
In the Threshold method, ChaosHunter produces buy or sell signals based on whether the formula is above a certain threshold (buy) or below another threshold (sell). The only way to force these thresholds to be the same is to set the threshold value to +/- zero, in which case both thresholds are zero. You set the threshold range based on what you believe the range of the formula will be. If you are building neural nets, for example, +/- 1 is probably good. If all of your inputs are in a certain range, then try that range, assuming the formula will evolve without expanding the range too much.
The mindset you have to get yourself into when building trading models includes the following Steve Ward’s Ten Trading Reality Axioms (copyright 2008):
1.Trading is an art, not a science. Thus the normal scientific methods do not apply.
2.Statistical methods generally do not apply either, because a number of studies have proven that the markets are NOT normally distributed. In particular, there is no such thing as a valid confidence factor in the markets. Confidence factors are fool’s gold.
3.No model you build will ever be perfect, and even the best models will show drawdown. You should be looking for a model that on average over time makes money.
4.Models are simply estimates, and you should not be worried about a small imprecision in data, equity calculation, etc. You are building rough guides to the future, not precision watches.
5.Some markets are predictable some of the time, but no market is predictable all of the time. Otherwise, everybody would be rich. To me, this is the true definition of “efficient markets”.
6.No model based on patterns in the past can be guaranteed to work in the future. It will only work when the patterns repeat in the future.
7.The past is the only prologue you have to the future unless you are psychic.
8.Sudden news events can ruin even the best model. To confirm this, just do a Google search on LTCM.
9.All models built upon past observation carry with them a risk of “over-fitting”. Optimization just increases that risk, because optimization is the best way to extract patterns. There is no free lunch.
10.The more analytic you are, the more you will ignore these axioms, throw away good models, and think you are not successful.
Chaos Input
Most definitions of chaotic functions provide for an input which is the last value the formula produced. Turn this option on if you have a time series where you believe that new outputs are affected by previous one, or that you are indeed dealing with chaos. We feel that price time series are almost always so affected. We have no guidance for the initial value except to say that it might be of experimental value.
For the current row of data, the program uses a value computed by the formula on a previous row of data. On the very first row (row #1) the chaos variable is set to an initial value (0 by default). The formula outcome on row #1 is calculated using input data from row #1 and the initial value (0) for the chaos variable. On the second row (row #2) the formula uses inputs from row #2 and the calculated formula value from row #1 for the chaos variable, and so on. Note that it can take quite a few rows of data before the ChaosVar takes on meaningful values (it is not possible to determine how many rows are needed for any particular case or even in general, but we guess at least 10 to 50). So with that in mind, here are the considerations:
1. Out-of-sample testing
If you look at an out-of-sample test, the ChaosVar starts with its initial value. That means it can take quite a few rows of data until the formula is really "up to speed" with respect to the Chaosvar. Out-of sample testing is really most accurate if the formula has had previous rows to include in the calculation of ChaosVar. So when used for trading, as an example, trading signals will be more accurate if the out-of-sample set is not evaluated by itself.
2. Inserting the formula into a trading chart
When you insert a formula containing the ChaosVar into a trading chart, the trading signals will be most accurate if there are a number of previous bars in the chart prior to the start of actual trading.
3. Repetition of results
If you attempt to compare the signals in your trading platform chart with the signals ChaosHunter showed, you will not be comparing "apples to apples" if the ChaosVar is in the formula unless both the ChaosHunter and the trading start on exactly the same bar.
4. Access on trading platforms
In order to insert a formula using ChaosVar into a chart, your trading platform must be capable of accessing the last value of the formula within the formula itself. (NeuroShell Trader Professional, for example, is not capable of that). If your platform is not capable you will have to either generate formulas without ChaosVar or insert your formula by calling the ChaosHunter Runtime server (as NeuroShell Trader Professional does).
Other topics of interest:
Trading Strategy Statistics Definitions