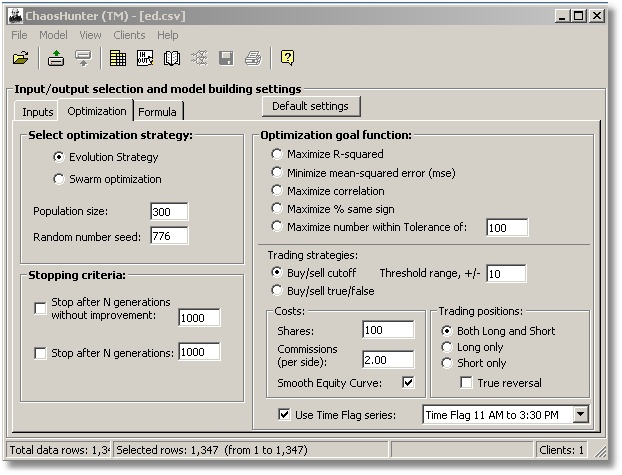
These user-selectable functions describe to the optimizer what it is to try to accomplish. Here are the details of each goal:
Maximize R-squared
R-Squared, also called the coefficient of multiple determination or the multiple coefficient of determination, is a statistical indicator usually applied to multiple regression analysis. It compares the accuracy of the model to the accuracy of a trivial benchmark model wherein the prediction is just the average of all of the example output values. A perfect fit would result in an R-Squared value of 1, a very good fit near 1, and a poor fit near 0. If your model predictions are worse than you could predict by just using the average of the output values, the R-Squared value will be negative.
Do not confuse R-Squared with r-squared, the square of the correlation coefficient, also called the coefficient of determination. These values are the same when using regression analysis, but not when using neural networks or other modeling techniques. The r-squared is usually the one that is found in spreadsheets. See any statistics book for more details.
Minimize mean-squared error
The mean-squared error is computed by taking the squares of the (actual result – the result predicted by the model) for each of the rows of data chosen to build the model. Then the average of all those squares is computed. As this average gets smaller, the model gets better.
Maximize Correlation
This goal does not seek to make the predicted results close to the actual values, but instead seeks to make the predicted results “trend” closely with the actual values. The statistical correlation between the actual results and the results predicted by the model is computed. As this correlation nears 1, the model is trending closely in the actual direction. If the correlation is near zero, the model does not trend at all with the actual. If the correlation is negative 1, the model is trending in the direction opposite the actual output values.
Maximize % same sign
This goal is not particularly concerned that the results predicted by the model closely match the actual results, but rather that the model produces results with the same sign as the actual results. In other words, if the actual value is > 0, then the predicted result should be > 0. If the actual value is <= 0, the predicted should be <= 0. This goal can be used to classify data instead of predicting, if one class is characterized by values > 0, and the other class is characterized by negative values or equal to 0. If your data is based around some cutoff value other than zero, subtract that cutoff value from the data first. For example, if one class of data is > .5 and the other < .5, then just subtract .5 from the data to use this goal.
Maximize Number within Tolerance
This goal requires a tolerance to be specified. The goal is to maximize the number in tolerance, in other words maximize number of rows where absolute value (predicted result – actual result) <= tolerance. The effect of this goal is not to get some results really close, but rather to get more results in an acceptable range.
Trading Strategies
Buy/Sell cutoff
This is a goal for making market buy and sell decisions. The optimizer is not trying to find a formula for the output. It is instead trying to find a formula as well as a threshold (cutoff) such that whenever the formula is > threshold, a buy signal is generated, and whenever the formula <= threshold a sell is generated.
Buy signals - If the strategy is in no position (neutral), a buy signal creates a long position. If the strategy is in a short position, a buy signal covers the short. If the strategy is already in a long position, the buy signal is ignored.
Sell signals - If the strategy is already long, a sell signal exits the long position. If the strategy is in no position, a sell signal creates a short position. If the strategy is already in a short position, the sell signal is ignored.
Thresholds can only be selected by the optimizer within the range specified on the dialog. If zero is specified, the threshold can only be zero.
In the Threshold method, Chaos Hunter produces buy or sell signals based on whether the formula is above a certain threshold (buy) or below another threshold (sell). The only way to force these thresholds to be the same is to set the threshold value to +/- zero, in which case both thresholds are zero. You set the threshold range based on what you believe the range of the formula will be. If you are building neural nets, for example, +/- 1 is probably good. If all of your inputs are in a certain range, then try that range, assuming the formula will evolve without expanding the range too much.
Buy/sell true/false
This goal is like buy/sell cutoff described above, except that buy signals are generated when the formula is true (non-zero) and sell signals are generated when the formula is false (zero). To use this goal you should be selecting Boolean and/or Relational operations which result in true/false answers. Using other numeric operations can result in formulas which mostly buy, because anything but zero is a buy.
Costs
You may choose the number of shares to simulate trading when building the model, as well as the commission. Commissions are per trade each way. Commissions are in the same units as the price, and trading assumes the point value is 1. Commissions can be represented as a fraction of a point. So if you went long 100 shares, with commissions of 2.50, and the price moved from 2.5 to 2.6, then you made 100 * 0.1 - 2.50 * 2 = 5.00 (dollars, euros, pounds, whatever). To simulate trading a contract worth $20/point, just use 20 shares. However, we recommend using commissions as a penalty for bad trades - increase commissions if the system wants to trade too much, decrease them if it doesn't want to trade enough. Don’t be afraid to try different commission amounts.
If you select “Smooth equity curve” while optimizing, the optimizer will still try to make more money, but it may give up some profit in order to achieve a smoothly rising equity curve. A smoothly rising equity curve will mean the model has experienced less severe “drawdowns”.
Trading Positions
Click on the appropriate button to choose whether you want your model to trade both long and short positions, long positions only or short positions only.
If you choose to build Both Long and Short models, Chaos Hunter either buys or sells. If you are not in a position when a sell occurs, the model will go “short”. A subsequent buy signal “covers” the short position. Yet another buy signal causes the model to enter into a “long” position. Yet another sell signal causes the model to exit its long position.
Some believe it is more efficient to reverse directly from a long position into a short, and vice versa, i.e. exiting the former position at the same time you enter the new one. Usually this is done by buying or selling double your current position. If you want this type of model, turn on the checkbox called “True reversal”.
Checking this option allows you to place a column in your data file that you may use to designate whether or not trading will take place during certain hours and/or conditions in an intraday model or certain days and/or conditions in a daily, weekly, or monthly model. The time flag column must contain either a 0 for no trades and any other non-zero value for trades.
ChaosHunter recognizes any column with a name of "TimeFlag" as the default name of a column containing this type of information, but other column names are allowed. If the column name is "TimeFlag", this column will be preselected in the Time Flag Series box, but the box must be checked in order for this type of data selection to be active. If the column has a different name, select it from the drop down list.
ChaosHunter automatically generates a signal to exit any open position when the data in the Time Flag column is 0.
For an exit to occur prior to a market close, you should change the time flag from 1 to 0 two bars before the bar on which you want to exit. For example, if you are working with a 5-minute chart and you want force ChaosHunter to exit any open position at 4:00 p.m., the timing is as follows:
3:50 p.m. bar: Time flag variable is set to 1
3:55 p.m. bar: Time flag variable is set to 0, and an exit signal for any open position is generated after the close of the 3:55 p.m. bar
4:00 p.m. bar: The open position is closed
Note that the time flag variable should continue to be set to 0 on any bar after the 3:55 p.m. bar until you want the model to return to trading. The time flag series does not prevent ChaosHunter from computing the formula, indicators, and Chaosvar on bars where the time flag=0. In other words, on bars with time flag=0 ChaosHunter still computes the predicted value, but no trading takes place except for the forced exit where time flag goes from 1 to 0.
Time Flags in other Programs
When firing a ChaosHunter model in NeuroShell Trader Professional or NeuroShell DayTrader Professional, the time flag is displayed as an indicator parameter, even though it is not part of the formula. The purpose is to link up time flag data stream in NeuroShell Trader with the corresponding value in the ChaosHunter model.
In TradeStation® and other trading programs, it will be necessary to include rules in the trading system that only issue trading signals when the time flag is set to a 1 or any other non-zero value
TradeStation® is a registered trademark of TradeStation Securities, Inc.