Once you have selected an optimization strategy, a goal, and the type of operations you want to include, you can click on the optimization icon ![]() or choose Start optimizing model from the Model menu. ChaosHunter will begin to create a formula for your problem. The process will continue until ChaosHunter reaches the stopping criteria you set on the Optimization tab or if you click on the STOP button. If you have a very large problem, you may want to use the ChaosHunter network version, which will spread the computations over multiple cores on the same computer or across a network.
or choose Start optimizing model from the Model menu. ChaosHunter will begin to create a formula for your problem. The process will continue until ChaosHunter reaches the stopping criteria you set on the Optimization tab or if you click on the STOP button. If you have a very large problem, you may want to use the ChaosHunter network version, which will spread the computations over multiple cores on the same computer or across a network.
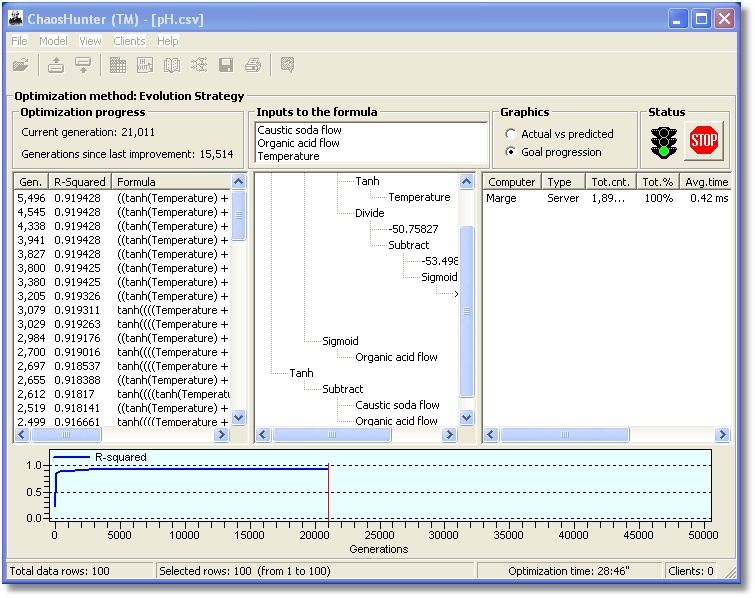
As optimization progresses, the screen displays the current inputs to the formula, as well as the formula in both a list and hierarchical (tree) form. The bottom of the screen displays a graph of either the actual versus predicted values or the progress towards the chosen objective function. If you are using the network version of ChaosHunter, you will see a list of the server and clients, if applicable, working on the problem.
Results for Out-of-Sample Set or Test Set
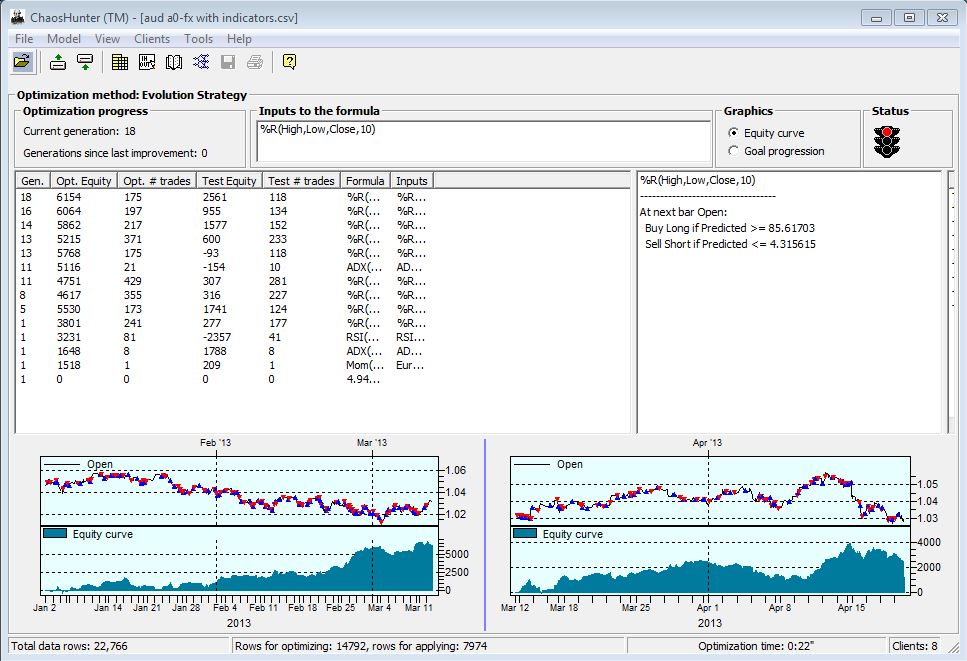
If you selected a test set of data on the datagrid, you will see results for both the optimization and test sets displayed in the statistics. You can sort the results by clicking on the label for any column heading.
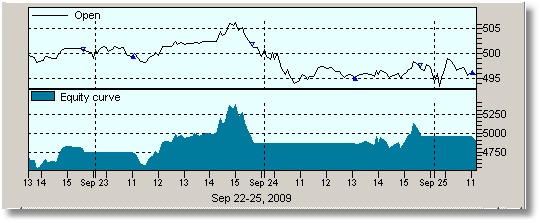
Graphs for both data sets are displayed below the statistics if you select "equity curve" for the graphics option on models with a trading objective or actual vs predicted on other models. The test set graph allows you to stop model optimization when you see good results on both data sets. For example on a trading model it is easier to determine if the ChaosHunter model is producing buy/sell signals on the peaks and valleys of the price data rather than simply looking at a total equity number.
Note: You can apply any model that is displayed on the screen by going to the Apply screen, and choosing a model from the list and clicking on the apply button.
Saving the Model
Once the optimization process stops, you can save the model by going to the File Menu, and selecting Save Model. A dialog box is displayed where you can type in a name for the model. You may also click on the ![]() Save Model icon to preserve the model for later use. The best model is saved by default. If you want to save one of the runner-up solutions, you must apply the runner-up formula to the data and then save that version of the model.
Save Model icon to preserve the model for later use. The best model is saved by default. If you want to save one of the runner-up solutions, you must apply the runner-up formula to the data and then save that version of the model.
You can right click on the graph to either export a copy or send the graph to the clipboard, a printer or a file. You can also right click on the tree view of the model and either print the tree or save a copy to the clipboard as an image.
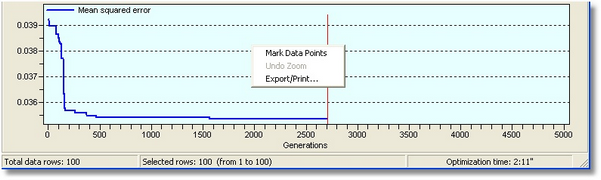
If you mouse click on Mark Data Points, individual data points are displayed on the graph.
Date/Time Numbering on the X-Axis in a Graph
If the data file includes a column labeled "Date" that includes valid data, the graph will display specific dates (and times if available) when the completed model is either being optimized or applied to a data file. Valid data means that the "Date" column must contain dates and times compatible with the user's Windows time zone settings, i.e., US formatted dates on a computer with the time zone set to a US time zone and German time zone settings on a computer set to a German time zone. If at least one date in the "date" column is not recognized as a valid date, then ChaosHunter disables date/time Numbering on the X-axis.