Applying the Model
After you've created a formula, you can apply it to either the data used to create the model or to another data file.
To apply the model to existing data: click on the ![]() icon on the toolbar or select Apply Model from the Model Menu.
icon on the toolbar or select Apply Model from the Model Menu.
To apply the model to a new data file: click on the ![]() icon on the toolbar or Select Open Data File from the File Menu. Next, click on the
icon on the toolbar or Select Open Data File from the File Menu. Next, click on the ![]() icon on the toolbar or select Apply Model from the Model Menu.
icon on the toolbar or select Apply Model from the Model Menu.
ChaosHunter automatically applies the best model based on the optimization function. However, you can select any of the runner-up formulas and click on the Apply Model button to view the results for the selected formula.
Saving the Model
You can save the model by going to the File Menu, and selecting Save Model. A dialog box is displayed where you can type in a name for the model. You may also click on the ![]() Save Model icon to preserve the model for later use.
Save Model icon to preserve the model for later use.
By default, ChaosHunter saves the best model. If you want to save one of the runner-up models, highlight that formula, click on the Apply Model button and then save the model.
One of the reasons you might want to use this capability is to save the model that works best on the out-of-sample set rather than the optimization set. Select several of the runner-up models and apply them to the out-of sample data. Choose the one that you believe works the best with the expectation that this particular model will continue to do well with future data. This is especially useful for trading models.
Note: If you have tried several different models and then want to save a particular model, once again highlight that formula and then click on the Apply Model button. Next save the model by either going to the File Menu, and selecting Save Model or clicking on the ![]() Save Model icon.
Save Model icon.
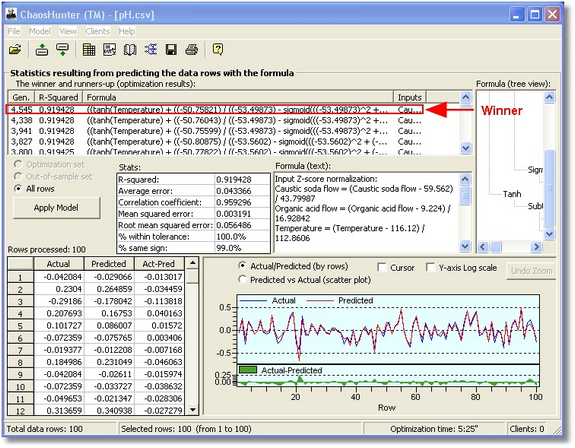
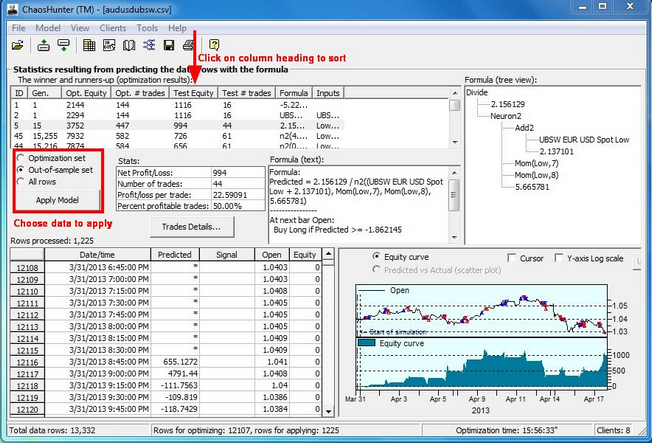
Note that if you separated your data file into an optimization set and an out-of-sample set, you can choose either or both data sets for model application. You can click on any column heading in the statistics grid to sort the column from high to low or low to high values.
The results screen allows you to examine the outcome of the optimization process, including statistics, actual and predicted values, and graphs of the results. In the Formula box you can view a list of inputs to the formula, as well as the formula itself.
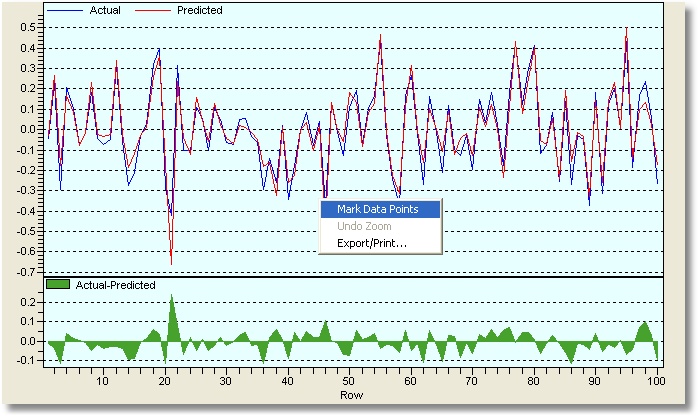
You can right click on the graph to either export a copy or send the graph to the clipboard, a printer or a file. You can also choose to mark data points.
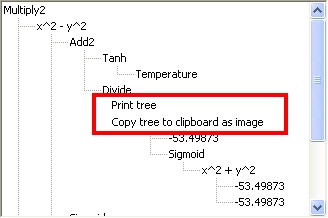
You can also right click on the tree view of the model and either print the tree or save a copy to the clipboard as an image.
Refer to the topic Undefined Outputs if asterisks are displayed as output values.
Trading Models
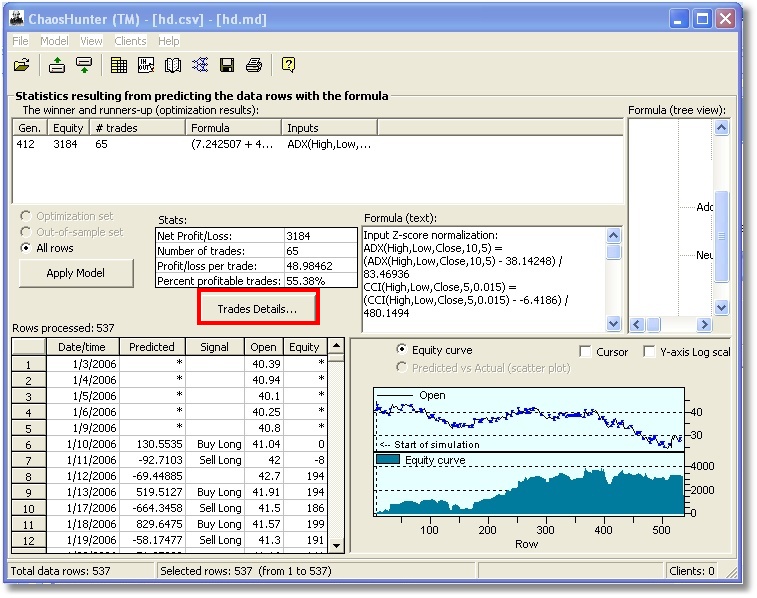
If you've selected a trading model, you can click on the Trade Details button to view statistics such as %Return, Cumulative Profit/Loss and Cumulative %Return in addition to Profit/Loss on each Trade and the fill date and price for all trading models. In order to properly compute these statistics, the trading strategy closes any open position on the last bar. Click here for details on the Trading Strategy Statistics.
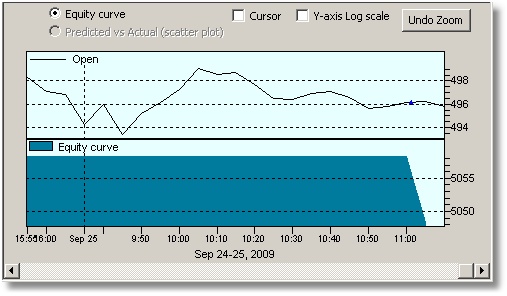
Date/Time Numbering on the X-Axis in a Graph
If the data file includes a column labeled "Date" that includes valid data, the graph will display specific dates (and times if available) when the completed model is either being optimized or applied to a data file. Valid data means that the "Date" column must contain dates and times compatible with the user's Windows time zone settings, i.e., US formatted dates on a computer with the time zone set to a US time zone and German time zone settings on a computer set to a German time zone. If at least one date in the "date" column is not recognized as a valid date, then ChaosHunter disables date/time Numbering on the X-axis.
Small Differences Between Actual and Predicted Values
If Actuals and Predicted values are very close, their difference might be very small. The graph then autoscales Y values and shows Y-axis marks in a weird form such as "10p" or "10u". When this occurs, the graph control displays a letter as a substitute for scientific notation. Below is the list of letter symbols that the graph control displays on the Y axis in case of extremely small or large values:
"p n u m K M B T "
1x10-12 is represented by the symbol p for pico
1x10⁻⁹ is represented by the symbol n for nano
1x10⁻⁶ is represented by the symbol u for micro
1x10⁻³ is represented by the symbol m for milli
1x10³ is represented by the symbol K for Kilo
1x10⁶ is represented by the symbol M for Mega
1x10⁹ is represented by the symbol B for Billion
1x10¹² is represented by the symbol T for Tera
Related Topic:
Formula Editor -The ChaosHunter Formula Editor allows you to make changes to a formula found by ChaosHunter or to create an entirely new formula that you may apply to your data file to view the results.