Click on the Format Chart button if you would like to modify an existing chart by changing the bar size, amount of historical data, or what data to download. The Change Chart Properties dialog is displayed. This screen will also allow you to change the symbol that is currently loaded in the chart.
Change Chart Properties
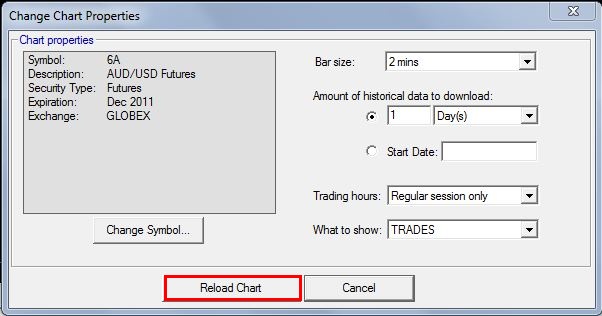
Bar Size: The ChaosHunter Trader works with the following bar sizes: 5, 10, and 30 seconds, 1, 2, 3, 5, 15, and 30 minutes, 1 and 4 hour bars, and daily bars, which are the bar sizes supplied by Interactive Brokers.
Amount of Historical Data to Download: Either enter a number of days, weeks, or months, or specify a start date. Note that if you specify a certain number of days back, the request will be for calendar days, not trading days. Therefore the data will include weekends and holidays, so you may not obtain data for the total number of days you specified.
If your ChaosHunter model uses the Chaos Input (ChaosVar), you should specify the same start date that you used to train your model. Click here for details.
You must load enough historical data for the ChaosHunter model to calculate in order to generate trading signals. For example if your ChaosHunter model includes an indicator such as %chg(Close, 10), the chart would have to include 10 bars before a trading signal could be generated. Otherwise, you will see the message "Not enough bars to fire the model" in the Order/Trade log of the ChaosHunter Trader." The message is most likely to be seen at the start of the trading day if you have only loaded one day of data, for example. To correct the problem, simply increase the amount of data loaded so the computations in the ChaosHunter model have sufficient historical data to produce trading signals.
Trading Hours: Click on the drop down arrow to select either All available data or Regular session only for stock or futures. For cash (Forex), all available data is supplied automatically.
What to Show: Click on the drop down arrow to select the price data you want displayed on the chart. (The price data should match the data used to train your ChaosHunter model.) The available selections will vary by the type of instrument: Trades, Midpoint, Bid, or Ask.
Trades includes the open, high, low, and close prices as well as volume.
Interactive Brokers does not supply trades or volume data for Forex. If you're trading Forex, and select trades, the ChaosHunter Trader will display the midpoint values. For Forex, the midpoint refers to the average of the bid and ask prices.
For stocks and futures, midpoint refers to the average of the high and low price.
Bid or Ask bars display the open, high, low, and close prices for either the bid or ask prices respectively.
Contact Interactive Brokers if you want more information on how these types are created.
Click on the Reload Chart button at the bottom of the screen to load data and display the chart.
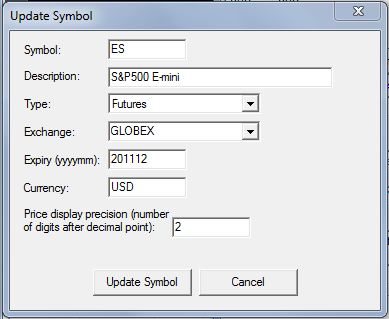
Change Symbol
Click on the Change Symbol button and then select the symbol from the list of previously added symbols. Click on the Edit Symbol button and the Update Symbol form to change the details you previously entered, such as adding a new expiration date for a futures contract or selecting a different exchange.
Click here for more information on adding or changing symbols.
After you have entered the required information, click on the Update Symbol button to include the symbol to the Symbol list.
Once the symbol is displayed on the list, you may create a chart by choosing the symbol from the list and clicking on the Select button. The Set New Chart Properties form is displayed, where you can specify chart settings such as bar size, how far back to load data, etc. Once you have entered your selections, click on the Add New Chart button to download data and display the chart.