Think of ChaosHunter as multiple non-linear regression on steroids. It is ideal for any type of forecasting, decision making, or model building based on example data.
You start with a text file usually exported from a spreadsheet. The spreadsheet consists of a number of observations (the rows). There are some number of variables (the columns). One variable (usually the last column) contains the actual answers for each of the observations. The other columns contain the variables which you want to use to build the formula.
In the following example, we want to find a formula that relates the variables we call Input1, Input2, and Input3 so that the formula produces the variable called Answer:
| Input1 | Input2 | Input3 | Answer |
|---|---|---|---|
| 3 | 7 | 4 | 21 |
| 4 | 2 | 0 | 8 |
| 2 | 3 | -2 | 6 |
| 1 | 4 | -7 | 4 |
| -6 | 9 | 6 | -54 |
If this file were exported from the spreadsheet as a .csv file, it would be ready to go into ChaosHunter. The first row containing the variable labels is included.
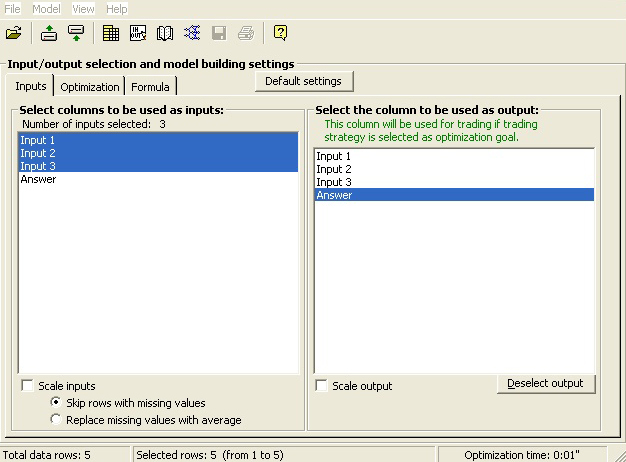
Once it is loaded into ChaosHunter, you tell the software which column (by label) is the output (which statisticians call the dependent variable). You also show ChaosHunter the variables that are candidates for use in the formula (which statisticians call the independent variables). The following picture shows that we have selected all three of the possible inputs:
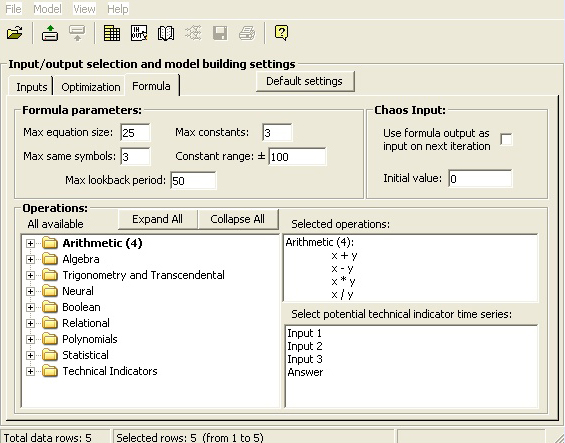
The next step is to inform ChaosHunter which of the many available functions you would like it consider when building a model for this data. The following picture shows that we have only chosen the four basic arithmetic operations:
Now we choose an objective function, which is essentially the measurement we want ChaosHunter to use in deciding which formula is better than another. The most common measurement is to reduce mean squared error, which we have selected in the following picture:

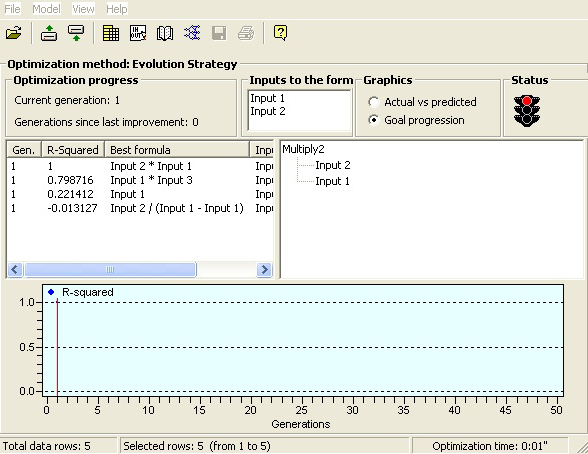
Now we tell the systems to optimize, which means hunt for a good formula as well as the correct inputs from amongst those you selected. Optimization can take from a few seconds to many hours depending on a number of factors. This easy problem takes only a few seconds because it is a simple problem with very few observations, and we only chose a few functions which happened to include the correct ones for the problem. The following picture shows that ChaosHunter found the formula, Input1 * Input2 (in computer speak, the multiply function is usually denoted by and asterisk *):
The next thing you might want to do is copy the formula you have found and use it in any way you choose. We have documented the exact way each of our functions operates. With our run-time features you can also embed a call to the formula into a Microsoft Excel spreadsheet, or ask your programmer to embed a call to the formula in your own software.
ChaosHunter for Financial Market Forecasts and Trade Timing
You can use ChaosHunter’s formulas to your advantage in creating profitable financial models for stocks, futures, options, and foreign exchange (currencies). The process is easy: obtain a data file, select input columns, decide on how to create the model, and apply the ChaosHunter formula to your data to examine results.
Start with a Data File
You begin with historical price data and perhaps your favorite indicators saved in a text file. Most trading software such as the NeuroShell Trader can export price data along with the technical indicators of your choice. This data can be loaded directly into ChaosHunter for model building, or edited first in a spreadsheet.
Choose Model Inputs and Technical Indicators
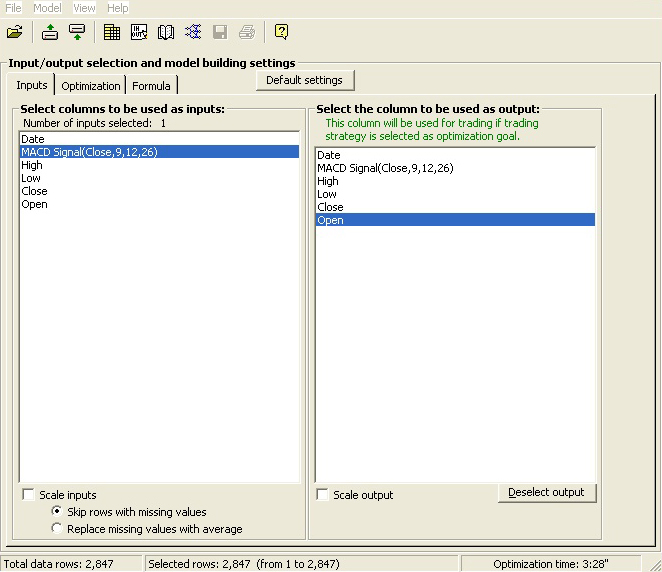
Once you have a data file loaded in ChaosHunter, you can choose the columns you want ChaosHunter to evaluate for possible inclusion in the formula. The next step for trading models is to choose a price stream such as the next open that is used to calculate the fill price when the model generates trading signals (enabling ChaosHunter to calculate equity curves, trading statistics, etc.).
ChaosHunter Can Calculate Indicators for You
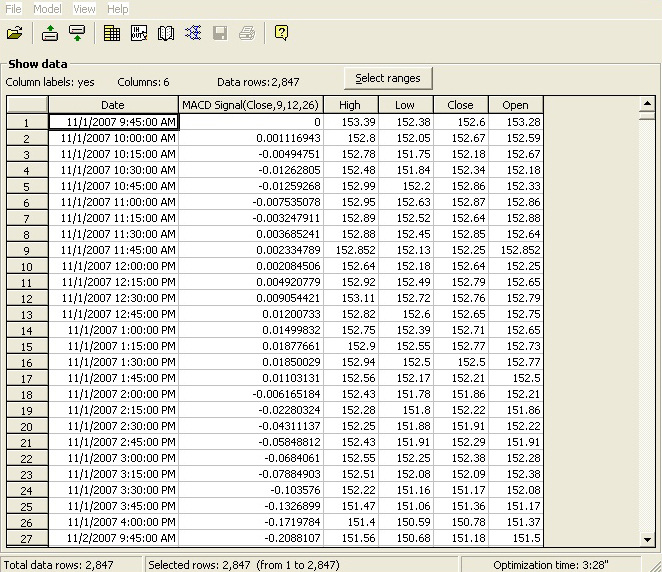
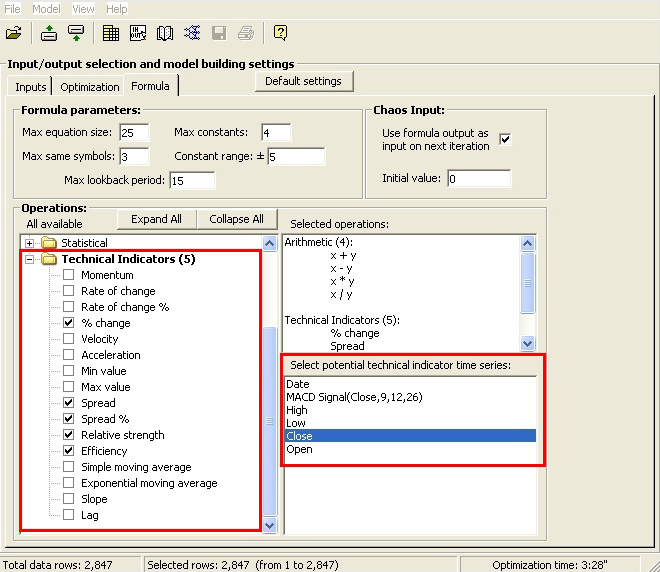
In addition to selecting columns from your data file, ChaosHunter can calculate standard technical indicators for inclusion in the formula. Check off the indicators of interest and then check one or more time series from your data file that will be used as the basis for calculating the indicators.
In the screen below the %change, spread, spread%, relative strength and efficiency indicators based on the close will be evaluated as possible inputs to the ChaosHunter formula as well as the MACD Signal indicator taken directly from the data file.
If you choose the Chaos Input, you allow ChaosHunter to include previous versions of the formula as an input to a new formula, thus enabling chaotic functions to be discovered.
Profit Objectives
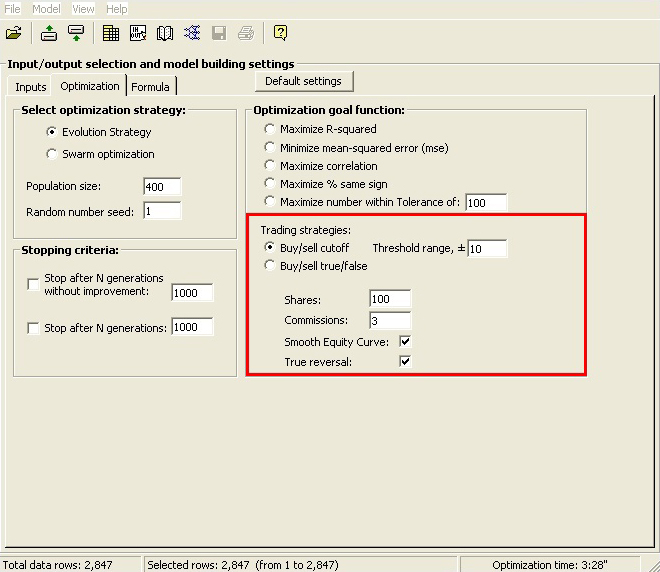
There are two profit based objectives that allow you to make a model based on how well it does in the market, instead of how well it forecasts prices. Choosing buy/sell cutoff generates a formula that is compared against a threshold value used to decide whether or not to enter a trade. You can even specify commissions and the number of shares you want to trade as factors that affect the formula.
Create the Trading Model
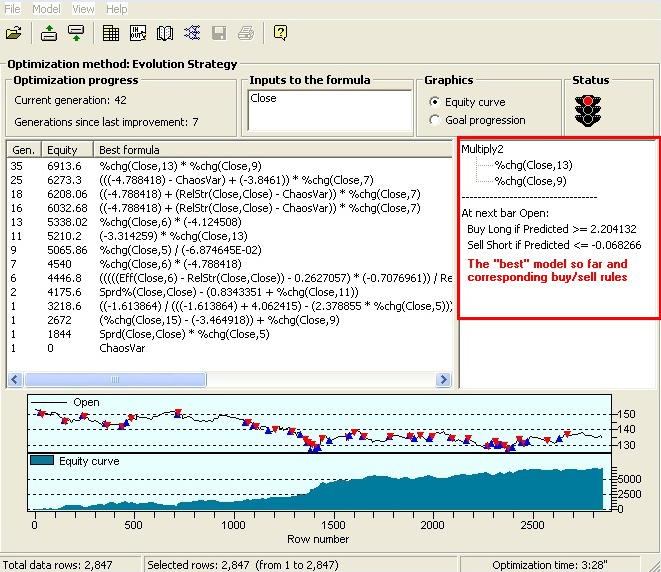
ChaosHunter displays a list of successful formulas as they are generated, so you can experiment further with the winning formula and the runner-ups. The “best” formula is displayed in detail, including the buy/sell rules. The bottom of the screen displays the buy/sell signals and corresponding equity curve.
Apply the Trading Model
Once you’ve built a model, you can apply it to your original data file or to a completely new data file that has the corresponding columns in the same order. For trading models, the results display the buy/sell signals plotted on a price curve and the corresponding equity curve..

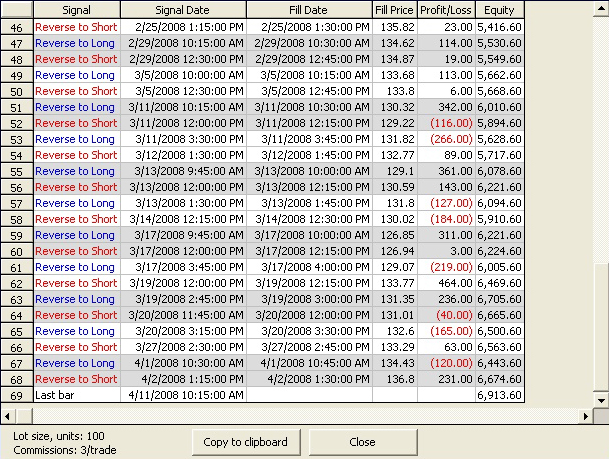
Click on the Trade Details button to examine specific trades. You have the option of copying the formula to the Windows clipboard for use in other programs.
ChaosHunter is not a complete trading system, so it does not contain a plethora of trading features. However, ChaosHunter models can be run in our NeuroShell Trader Professional software (release 5.5 and greater). Since the formulas can be read and exported, you can also use these formulas in other trading software.