You can use all of the rows in your data file to create the formula or you can select certain rows to build the formula and use the remaining rows to verify that your model is working. The out-of-sample data rows are not used to build the formula. Applying the formula to the out-of-sample rows enables you to evaluate performance on data the model has never “seen” before. Applying a formula to data not used in the creation process is the best method of evaluating a formula's performance and will enable you to project how the formula will function in the real world. If you do not select any rows, the program uses all of the rows in the file to build the formula.
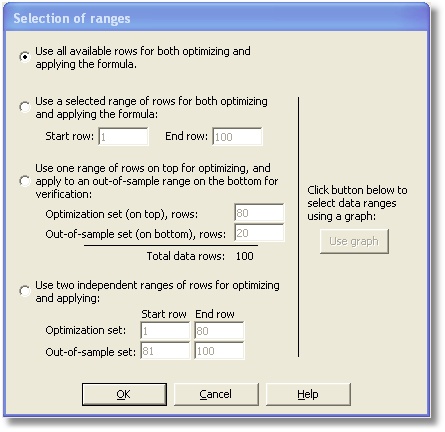
Click on the "Select Ranges" button to view this selection screen.

The first option will train the model on all of the rows of data in the file.
The second option will train the model on the data in the range between the start and end row listed on the screen. You can type the row numbers in the edit boxes. Rows that are not selected may be used later for testing the formula.
The third option will build the formula with data in row numbers up to and including the row number listed in the box “Top range for training”. (Notice that if you adjust one row number, the other is adjusted automatically.) Data for the out-of-sample set will be taken from the end of the file. The number of rows included in the out-of-sample set is listed in the box “Bottom range for applying”. The data for the training set and out-of-sample set must be adjacent to one another.
The fourth option allows you to select the optimization and out-of-sample data sets totally independent of one another. For example, you can optimize on the most recent data and apply the model to older data. Simply enter the start row number and end row number for both the optimization set and out-of-sample set.
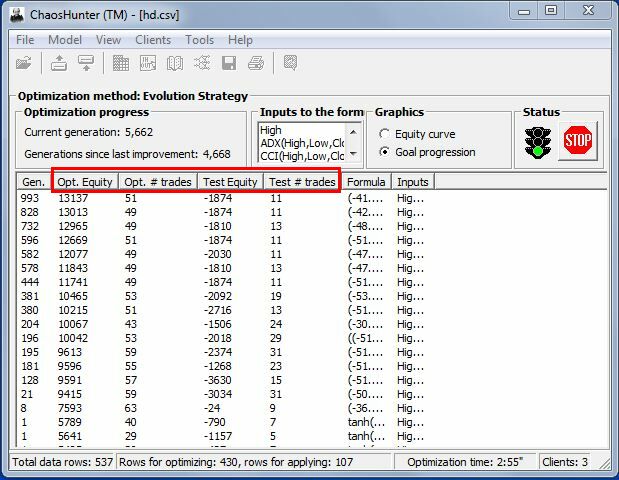
Note: If you select Options 2, 3, or 4, the results for both the optimization data set and the out-of-sample data (test) sets will be displayed during the optimization process. Otherwise, only the results for the optimization data set will be displayed.

Graphic Data Selection
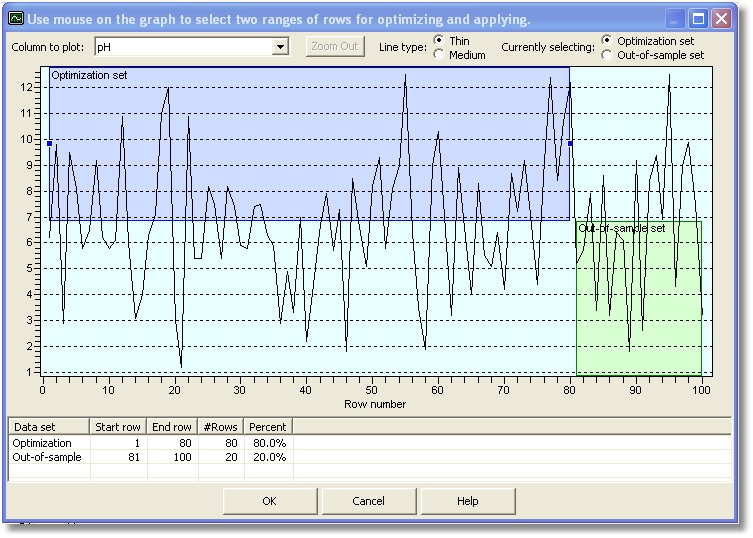
If you want to select the optimization and out-of-sample data sets graphically, click on the Use graph button.

The data grid allows you to select the optimization and out-of-sample data sets totally independent of one another. For example, you can optimize on the most recent data and apply the model to older data. Click on either the optimization set or out-of-sample set and then mouse click on the graph to select the data you want to include in the specific set.