Data file: pH.csv
This example models an imaginary chemical reactor, namely a water titration reactor. The reactor has two tubes feeding in the organic acid solution and the caustic soda solution. Inside the reactor there is a heater. The reactor produces the water solution of a given titration (pH). The reactor operator has two regulators to vary the flow rate of acid and soda, as well as a knob to vary the temperature inside the reactor. It may sound simple, but due to the very complex chemistry between acid and soda when brought together, the resulting solution pH depends in a very non-linear (and still unknown for this type of reactor) manner based upon both fluid flow rates and the temperature.
The task is to build a formula which would tell to the operator the titration pH to expect given the acid and flow rate settings as well as the temperature inside the reactor. For the mathematically minded reader, we want to find a function f such that:
pH=f(acid, soda, temperature)
Collect Data
The very first step is to collect the actual data. The operator was asked to run the reactor and to vary the acid flow rate, the soda flow rate, and the reactor temperature in their corresponding maximum ranges and carefully record the resulting pH values for each combination of the process parameters. It turned out that the soda flow rate could be varied in the 45 to 75 range (using arbitrary units), the acid flow rate in the 3 to 15 range (using arbitrary units again), and the temperature in the 80 to 160 F range. The resulting pH was measured and was noted to vary considerably between 1 and 13. A total of 100 data records were collected into a spreadsheet and identified by a numeric run number as show here:
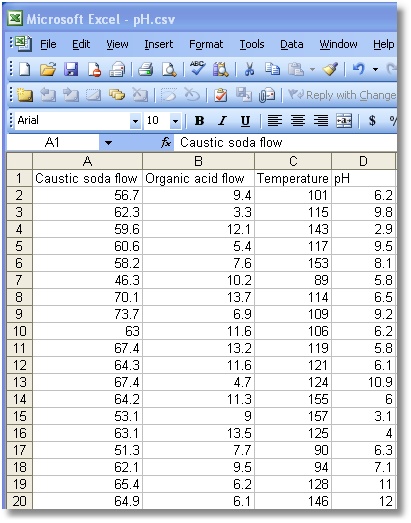
Next the data was exported from the spreadsheet into a comma separated value (CSV) file so that Chaos Hunter can read it. The data can be found in the pH.csv file in the Chaos Hunter\Examples folder.
Load a Data File
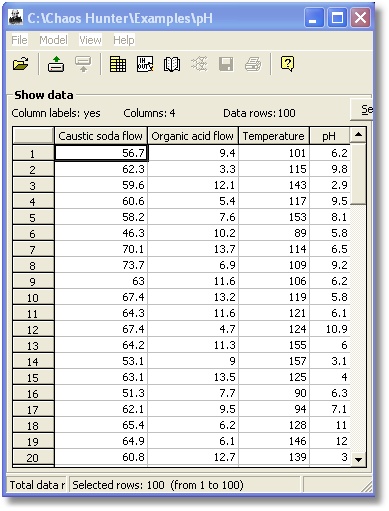
To load the data into ChaosHunter, you can either go to the File Menu and select Open Data File or click on the folder icon on the ChaosHunter toolbar: ![]()
Select the Input and Output Variables
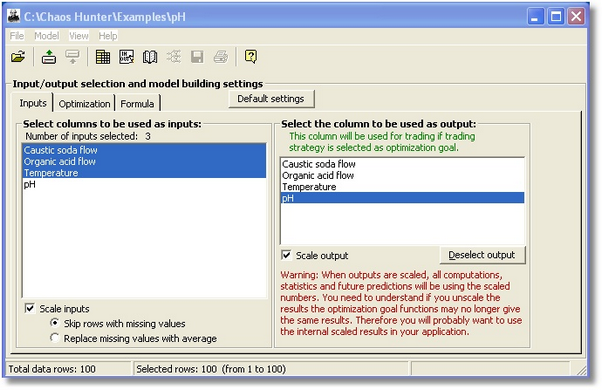
To load the model building settings, you can either go to the Model Menu and choose Select inputs/outputs and set building parameters or click on the In/Out icon on the ChaosHunter toolbar: ![]()
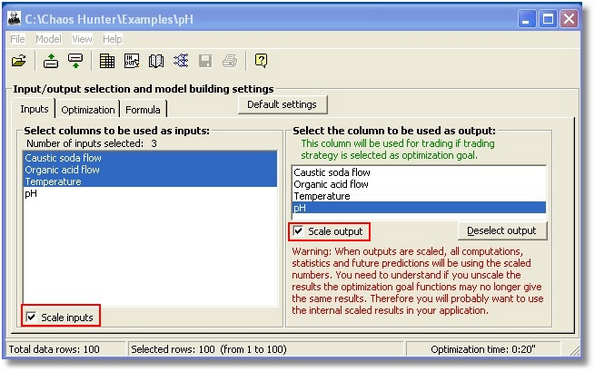
The inputs (independent variables) we want our formula to use are acid, soda, and temperature. We used the mouse to left click on these columns. We also used the mouse to select pH as the output of the formula (the dependent variable).
We clicked on the check boxes for scaling the inputs and output values. Scaling is based on the statistical Z-score. This option generally results in better numbers when your numbers are large, but the models are more complex and harder to understand.
Because we know that our data file does not contain any missing values, we just used the default to Skip rows with missing values.
Determine Optimization Settings
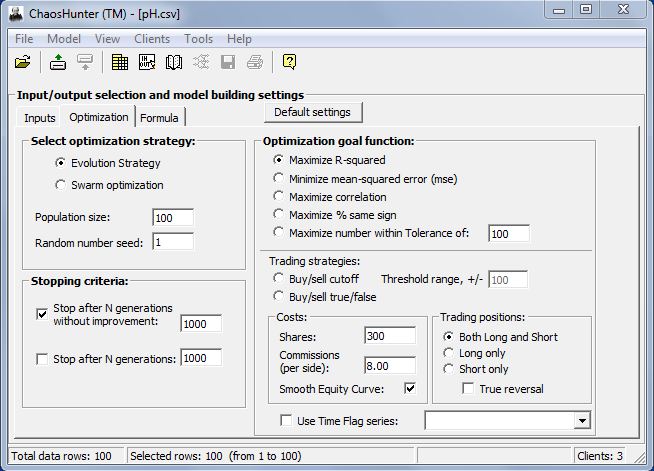
Select Evolution Strategy or Swarm Optimization
Evolution Strategies are variants of genetic algorithms that use real numbers instead of integers in chromosomes, and therefore do not cross segments of a chromosome, but instead cross whole chromosomes. The individuals represent potential solutions to a problem. The individuals are tested by a fitness function and the results are used to determine if the individual will be included in the next generation of potential solutions. The other type of optimization, Particle Swarm Optimization is similar to genetic algorithms in that it begins with a random population of solutions in the form of individuals. (Individuals represent a set of problem values that are being optimized.) As time progresses, the individuals "swarm" generally towards the best individuals, but not directly as some randomness is involved. The best individuals are judged by a fitness function relevant to the problem, e.g., maximize the number of correct classifications or minimize the number of false negatives. Since we have no prior knowledge of which type of optimization will solve our problem, we'll begin with Evolution Strategy and then test Swarm Optimization. We'll use the default value of 100 for population size to keep the problem relatively small and use the default random number seed value of 1. We understand that changing the random number seed can change the resulting formula.
Stopping Criteria
In order to test several models, we decided to stop developing the formula after 1000 generations saw no improvement.
Select Optimization Goal Function
We chose the first optimization goal of trying to maximize the R-squared value because it is a standard statistical indicator usually applied to multiple regression analysis. It compares the accuracy of the model to the accuracy of a trivial benchmark model wherein the prediction is just the average of all of the example output values. A perfect fit would result in an R-Squared value of 1, a very good fit near 1, and a poor fit near 0. If your model predictions are worse than you could predict by just using the average of the output values, the R-Squared value will be negative. Selection of an optimization goal should be consistent with the type of problem you are trying to solve. See the topic Optimization Goal Functions for more information on selecting the appropriate optimization goal.
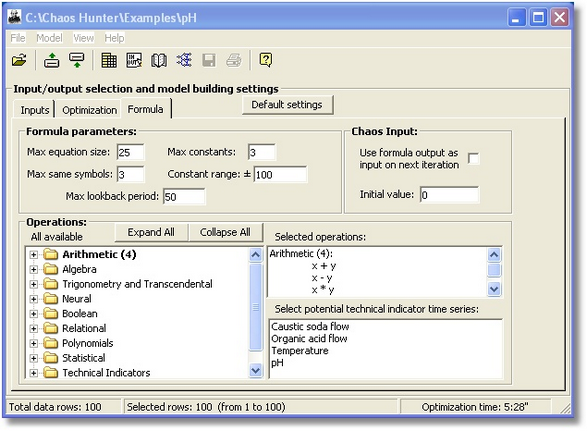
Choose the Mathematical Operations We Want in our Formula
As it turns out, all the default settings in ChaosHunter are set sufficient for finding a good formula for pH from the data. Not all problems will be so, and in subsequent examples we will show you how to evaluate the settings and change them from their defaults.
Create the Formula
Once you've selected the settings for building the model, you can either go to the Model Menu and choose Start optimizing model or click on the Open Book icon ![]() on the ChaosHunter toolbar. The model continues to develop the formula until 1000 generations saw no improvement.
on the ChaosHunter toolbar. The model continues to develop the formula until 1000 generations saw no improvement.
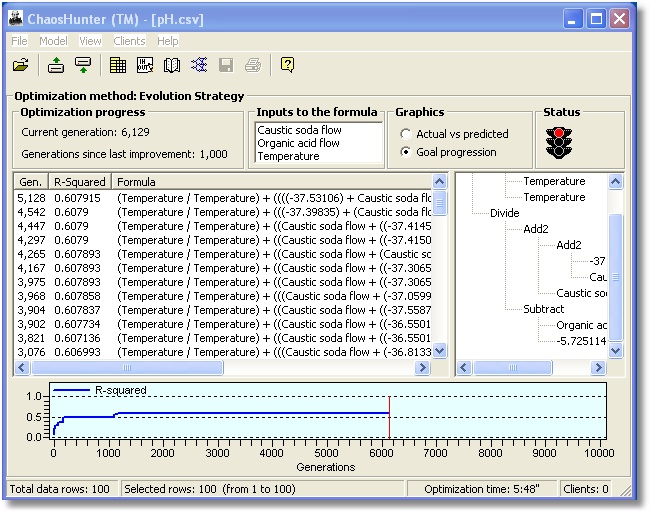
Evolution Strategy produced an R-Squared value of 0.607915. The formula found by ChaosHunter is:
Predicted = (Temperature / Temperature) + ((((-37.53106) + Caustic soda flow) + Caustic soda flow) / (Organic acid flow - (-5.725114)))
The next step is to try scaling the data while keeping all of the other settings the same. Click on the ![]() icon and return to the Inputs tab to select scaling for both the inputs and the output.
icon and return to the Inputs tab to select scaling for both the inputs and the output.
Click on the Optimizing Icon ![]() to build a new formula. The following message is displayed. Because we want to start optimizing this model from the beginning, we click on the "No" button to begin creating a formula without using any of the terms from the previous formula.
to build a new formula. The following message is displayed. Because we want to start optimizing this model from the beginning, we click on the "No" button to begin creating a formula without using any of the terms from the previous formula.
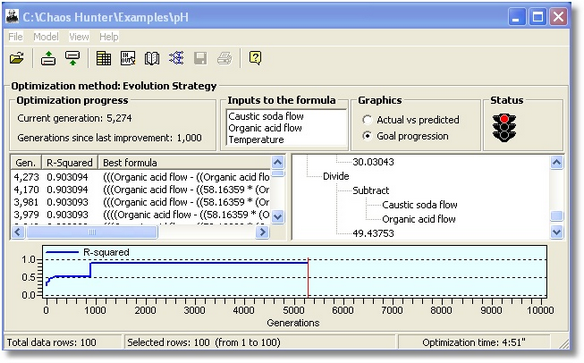
The use of scaling brought the R-squared value up to 0.865305, so we recommend it as a useful technique to improve the model.
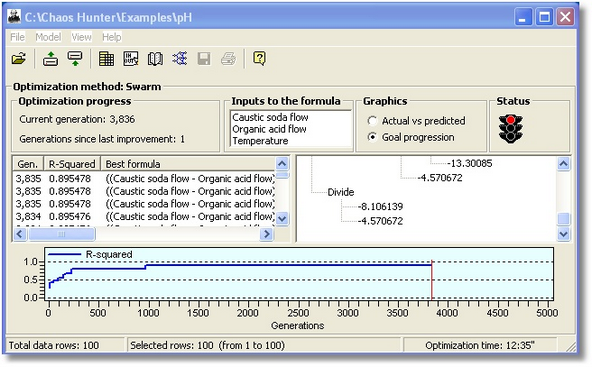
Next we thought we'd try Swarm Optimization with the other options remaining the same. This model didn't do quite as well, with an R-squared value of only 0.899107.
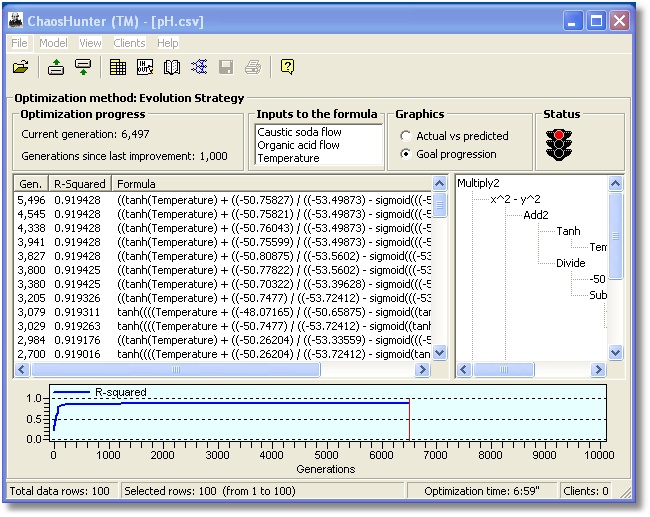
We switched back to Evolution Strategy optimization and then added neural networks and polynomial terms as possible inputs to the formula. That increased the R-square value to0.919428 based on the following formula:
Predicted = ((tanh(Temperature) + ((-50.75827) / ((-53.49873) - sigmoid(((-53.49873)^2 + (-53.49873)^2)))))^2 - sigmoid(Organic acid flow)^2) * tanh((Caustic soda flow - Organic acid flow))
In an effort to improve our model, we could try to vary Max Equation Size, Max Same Symbols, Max Constants, or Selecting the Constant Range. For now, we'll leave that investigation up to the user.
The next step in the process is to apply the formula we've developed to our existing data. Click on the Apply ![]() icon.
icon.
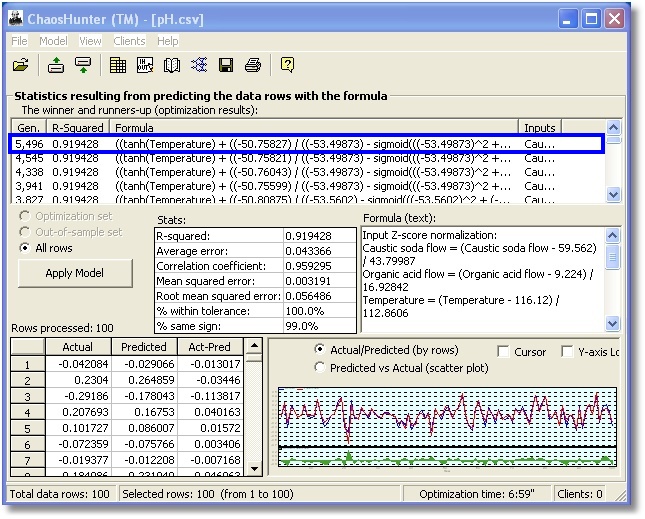
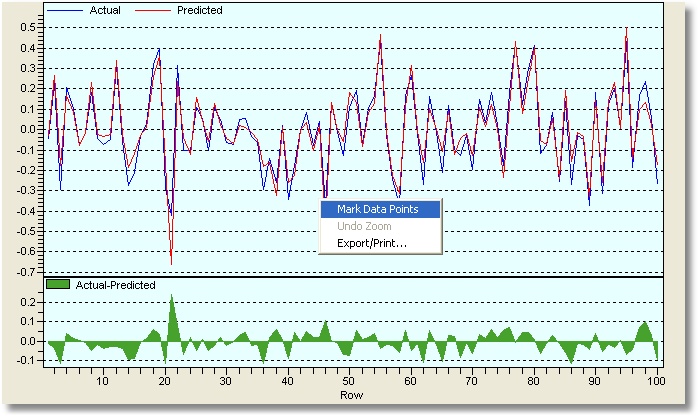
This screen allows you to examine results of the optimization process, including statistics, actual and predicted values, and graphs of the results. In the Formula box you can view a list of inputs to the formula, as well as the formula itself. The results shown correspond to the formula at the top of the list, the winner during optimization. You can use the mouse to select other formulas on the list and then click on the Apply Model button to view the corresponding results.
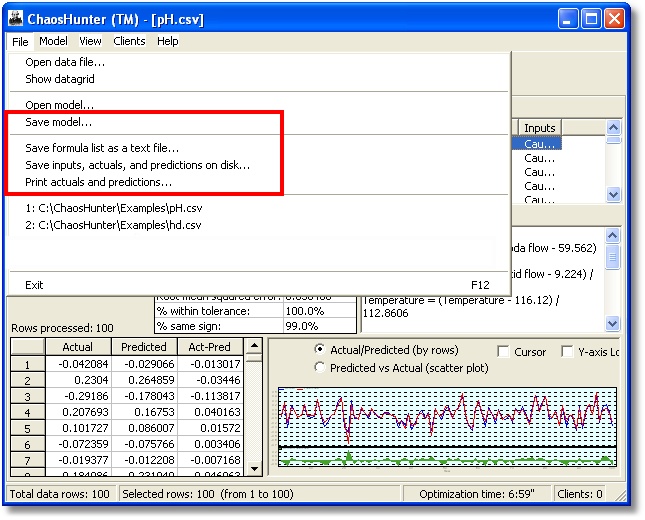
If you select the File Menu, you have several options to Save the model, save the formula list as a text file, save the input values from the formula as well as the actual and predicted values, or print out a list of actual and predicted values, either to another file or on your printer. You can also use the Save Model icon ![]() on the toolbar.
on the toolbar.
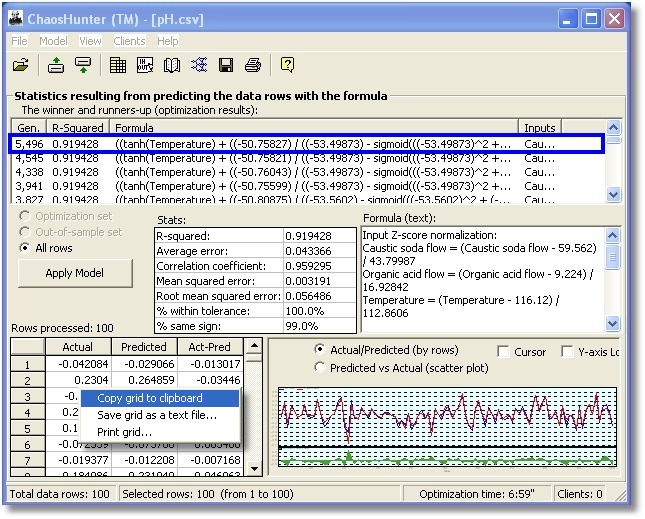
If you right click on the list of actual and predicted values, you are presented with several options for saving the list:
Right clicking on the graph allows you to export or print the graph or mark individual data points.