Market Neutral Pairs Spread Trading with ChaosHunter on www.ward.net
To download the NeuroShell charts and ChaosHunter files for the following topic, go to the ChaosHunter section of the tech support web site, www.ward.net, and find the topic "Market Neural Pairs Spread Trading with ChaosHunter" in the New and Updated Examples section. Move all of the ChaosHunter .md files to the NeuroShell Trader template folder so that the ChaosHunter models will execute in the NeuroShell charts.
ChaosHunter and Pairs Trading
Many professional traders choose to trade pairs of stocks which usually closely follow one another. When the prices of the pair diverge a significant amount, the lower priced stock is purchased and the higher stock is shorted in hopes of a later price convergence. It is not always easy to find an acceptable relationship between stocks you would like to trade, however. If the prices of stocks themselves do not provide a nice spread relationship, it is possible to make an algebraic modification of one of the pairs to provide a relationship that is better and easier to trade in a market neutral fashion.
ChaosHunter can easily make those algebraic modifications to find acceptable relationships between stock pairs, or even between multiple stocks. These relationships must be simple linear relationships (that is, each stock is multiplied by a constant plus another optional constant). Therefore, you must only allow ChaosHunter to choose from plus, minus, times, and divide. Use only formulas that are linear and produce a crossover relation as shown on the examples below. Fortunately, ChaosHunter finds simple linear relationships in the majority of cases we have tried. Based on the formulas that explain the relationship, you can pick proper numbers of shares to keep your trades close to market neutral.
In the sequence of charts that follow, we have loaded the prices of several stocks into the NeuroShell Trader Professional for data collection, display, and subsequent trading, but many other platforms will work as well. In some cases we have simplified the arithmetic involving constant terms before displaying in NeuroShell. For example, XOM - ( SPLS - 3.42231 - 6.101346) is simplified to XOM - SPLS + 9.5. Therefore some computations below may only be approximate.
Also in the profit computations that follow we are ignoring commissions, slippage, and fees. We did not verify that the stocks we used did not experience stock splits during the times we analyzed them, but you should either not use periods with splits or back adjust for them.
Example 1
In this example we wanted to find a spread relationship to trade Microsoft. We loaded about 6 technology stocks into NeuroShell to obtain price histories, and then exported them for loading into ChaosHunter. We instructed ChaosHunter to find a formula to compute the price of MSFT based upon these 6 stocks. ChaosHunter picked only CSCO to make the computation and came up with:
MSFT = CSCO / 1.91 + 13.75
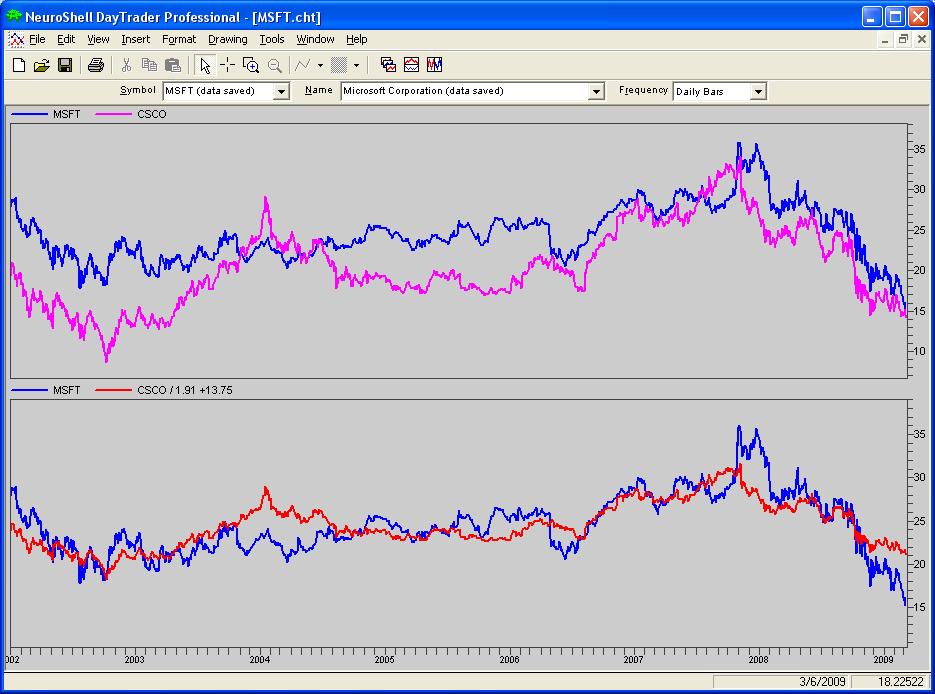
The top subgraph of the chart above shows the relationship between MSFT and CSCO with raw prices. The bottom subgraph shows MSFT and MSFT computed from CSCO. It should be obvious from the graphs that MSFT computed from CSCO may provide different pair spread trading opportunities than using the raw prices. You buy and sell the two stocks when the price of MSFT is out of line with the computed price based on CSCO
For example, on 3/8/2004, the bottom subgraph shows that MSFT at 21.65. However, based on the formula and the price of CSCO, it should be 25.45, or else the price of CSCO is too high at 22.36. Therefore, we want to buy MSFT and short CSCO.
If we buy 1000 shares of MSFT at 21.65 we pay $21,650 ignoring commissions, slippage and fees. A market neutral amount of CSCO is $21,650 / 22.36 = 969 shares.
Now on 8/11/2004 MSFT is at $22.98, or close to where it should be according to the formula, which reads 23.32, while CSCO is 18.29. If we sell MSFT and cover CSCO, our profit is:
for MSFT 1000 x (22.98 - 21.65) = $1,330
for CSCO 968 x (22.36 - 18.29) = $3,940
It must be emphasized that the price computation is an average based upon the time period over which the stocks are analyzed, and different formulas might be obtained if shorter and/or intraday periods are analyzed.
Example 2
In this example we set out to do pairs trading with pharmaceutical stocks. We loaded and examined Wyeth, Glaxo, and Bristol-Meyers.
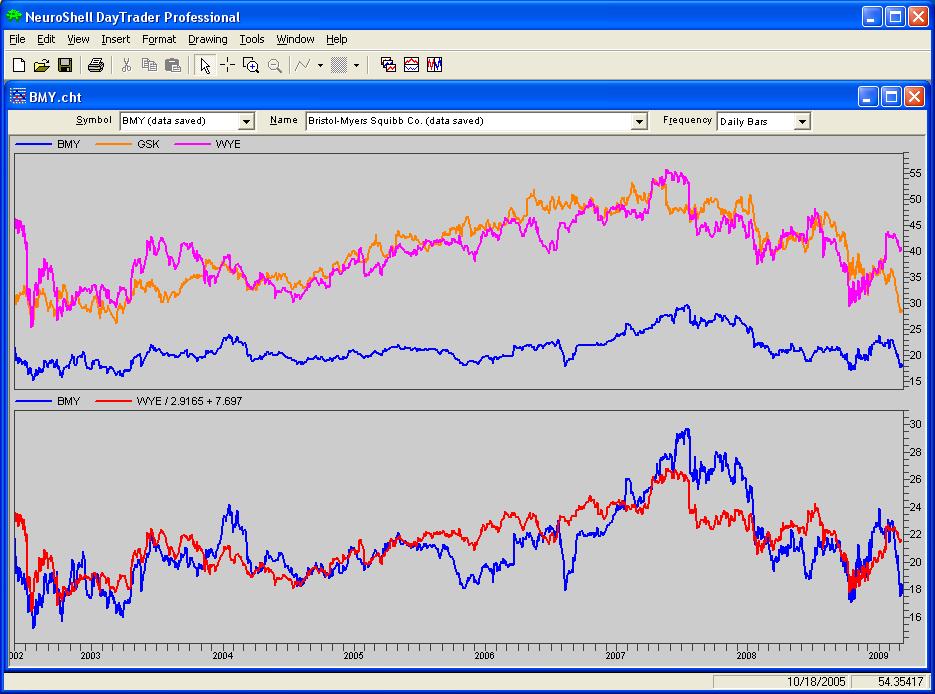
As you can see by the top subgraph of raw prices, WYE and GSK are pretty good pairs trading partners already. But suppose we wanted to trade BMY? It is hard to see how to do any pairs spread trading from the raw prices. So we loaded the data into ChaosHunter to see if the price of BMY could be computed by using the other two. Again, ChaosHunter found that the best relationship used only one stock, WYE, and came up with:
BMY = WYE / 2.9165 + 7.697
On 8/10/2006 BMY was at $18.47 but according to the formula and WYE at 44.99, it should have been 23.14. So we would have wanted to buy BMY and sell WYE short. Buying 1000 shares of BMY is neutral with selling 410 shares of WYE
Later on 11/6/2007 the BMY at 24.09 was near the computed value of 24.04 based on WYE at 47.69. If we had covered WYE and sold BMY our profit would have been:
for BMY 1000 x (24.09 - 18.47) = $5,620
for WYE 410 x (44.99 - 47.69) = $1107 loss
Example 3
Still hoping to be able to demonstrate a case where a more complicated relationship might be necessary, we chose a number of stocks that are in different industries to find a relationship for Colgate-Palmolive. We loaded CL along with XOM, SPLS, WYE, and SWK.
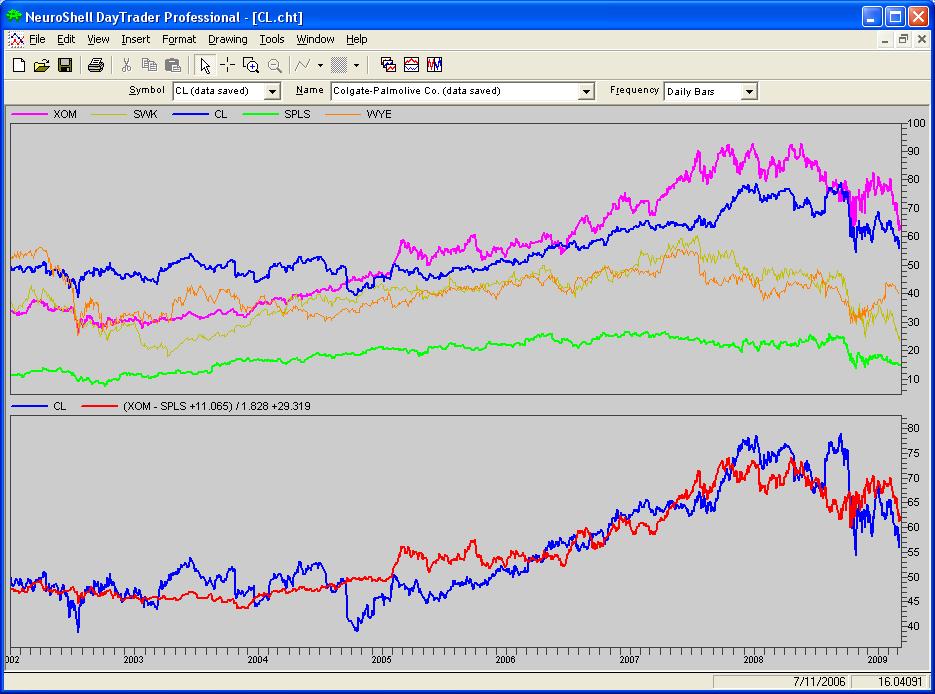
It wasn't long before ChaosHunter computed:
CL = (XOM - SPLS + 11.065) / 1.828 + 29.319
We still have a simple linear formula, but this time a couple of stocks produced a better relationship than just a single stock. If we had let ChaosHunter run longer it is possible it could have either dropped one of the stocks in the formula or added another, probably without significant change in the effectiveness of the formula, however.
On 9/26/2005 we have a big spread between CL at 47.59 and what it should be 57.34. So we buy 1000 CL and short XOM (393 shares) but long SPLS (1169 shares). The reason we go long with SPLS is because it is negative (subtracted) in the formula. There is no reason the dollar amounts of XOM and SPLS have to be equal if you have some other scheme in mind.
On 3/9/2006 CL at 53.76 is close to computed of 53.07. XOM is 55.75 and SPLS is 23.4. Profit is:
for CL 1000 x (53.76 - 47.59) = $6,170
for XOM 393 x (60.51 - 55.75) = $1,871
for SPLS 1169 x (23.4 - 20.34) = $3,577